

Introduction
Why is Bitcoin going down? This is the burning question among investors, traders, and crypto enthusiasts every time BTC takes a dive. Whether you’re holding long-term or day trading, sudden drops in Bitcoin’s value can cause concern—and confusion. This article dives deep into the real reasons behind Bitcoin’s recent price declines and how to interpret them in the context of larger financial trends.

Understanding Bitcoin Price Fluctuations
Bitcoin’s Volatility: Feature or Flaw?
Bitcoin is known for its volatility. Unlike traditional assets, its price movements are often sharp and driven by speculative sentiment, low liquidity, and rapid news cycles.
External Macroeconomic Factors
Why is Bitcoin going down when the global economy shifts? Here’s the breakdown:
- Rising interest rates from central banks
- Inflation concerns shifting investor preferences to safer assets
- USD strength affecting crypto prices inversely

The Role of Market Sentiment
Fear, Uncertainty, and Doubt (FUD)
Media headlines and influencer narratives play a big role. Negative news—even unverified—can tank the market.
- Regulatory rumors (e.g., US SEC lawsuits)
- Exchange insolvency speculation
- Hacked wallets or lost funds incidents

The Impact of Liquidations
- Cascading liquidations from leveraged long positions
- Exchanges like Binance, Bybit showing $B liquidation spikes

On-Chain & CEX Data You Shouldn’t Ignore
Exchange Flows & Whale Activity
- Sudden large BTC inflows to exchanges usually signal sell-offs
- Whale wallet movements tracked via platforms like Whale Alert
Funding Rates and Open Interest
- Negative funding = more shorts than longs, sentiment bearish
- Open interest spikes + price drop = unsustainable bullish bias

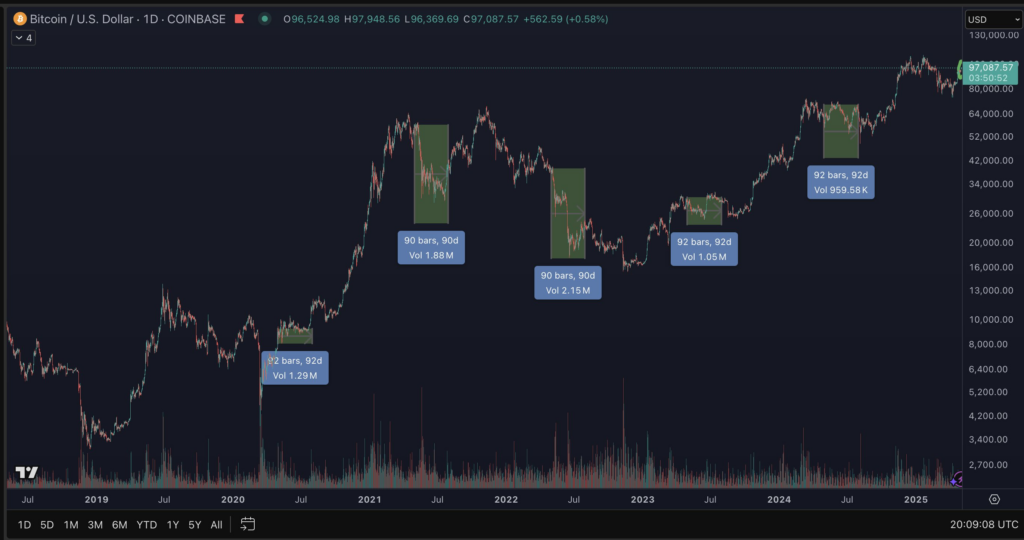
Historical Cycles & Timing Patterns
Post-Halving Corrections
Historically, Bitcoin sees a pullback 2–6 months after halving events. April 2024 halving may be triggering this.
Sell in May – Does It Apply to Crypto?
Traditionally, markets see outflows in May. Bitcoin often mirrors this due to overlapping investor behavior.

What You Can Do as an Investor
Short-Term Traders vs Long-Term Holders
- Traders: Use stop-loss, manage leverage, follow CEX data
- Holders: Dollar-cost average, focus on fundamentals
Risk Management in a Bearish Cycle
- Don’t overexpose to a single asset
- Rebalance based on macro and technical indicators
Discover: Bitcoin ETFs Attract $3 Billion, Driving BTC Near Record Highs
Conclusion
Why is Bitcoin going down is not just a question of charts—it’s a mix of global economics, sentiment, and trading mechanics. By understanding these drivers, investors can navigate downturns with more confidence and less panic.


